
Asset Overview
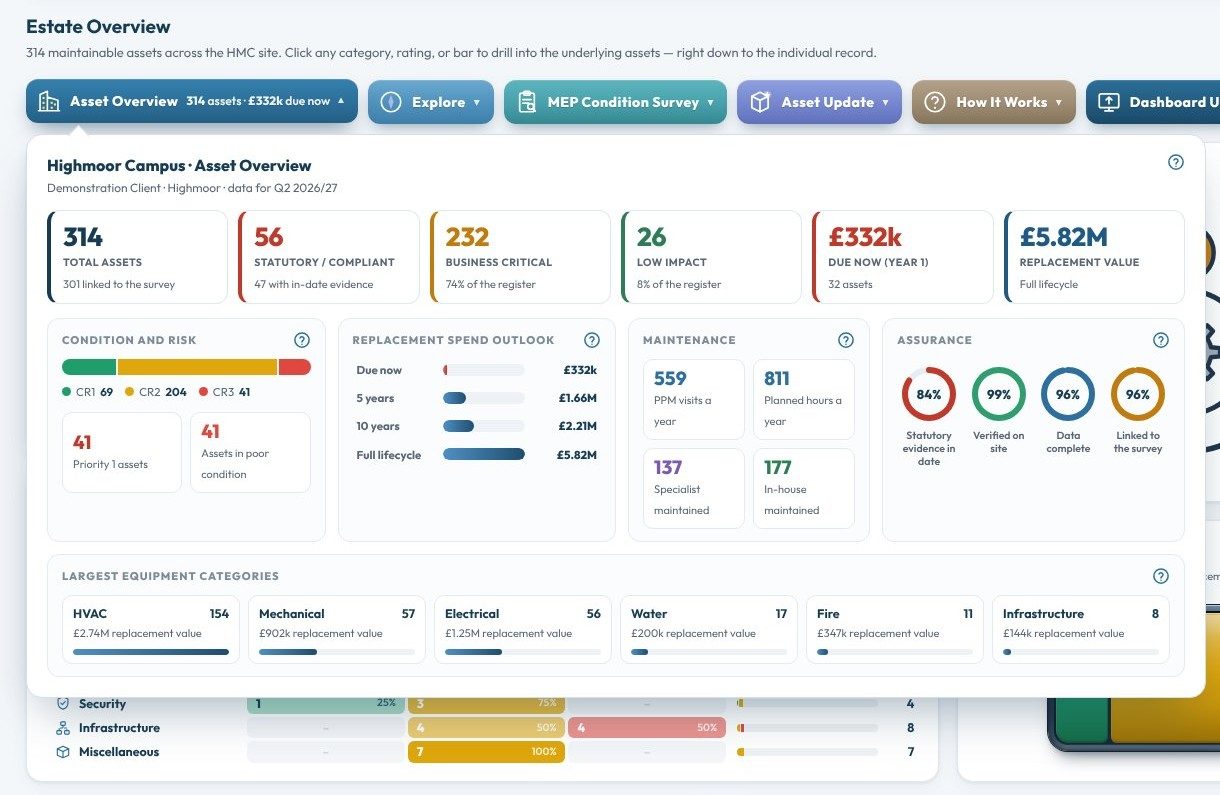
The headline figures for the estate in one panel: assets, impact, spend due, condition, maintenance workload and assurance scores. Select any figure to list the assets behind it.
The Seven Plus dashboard holds the verified record of every maintainable asset across your buildings, so anyone authorised can see, explore and act on it without opening a spreadsheet. Every tile, bar, room and figure lists the assets behind it, and each asset opens its full record.
The overview answers three questions at a glance: what you have, what state it is in, and what needs money or attention first. Beneath it, deeper views are grouped into four areas.
The headline figures for the estate in one panel: assets, impact, spend due, condition, maintenance workload and assurance scores. Select any figure to list the assets behind it.
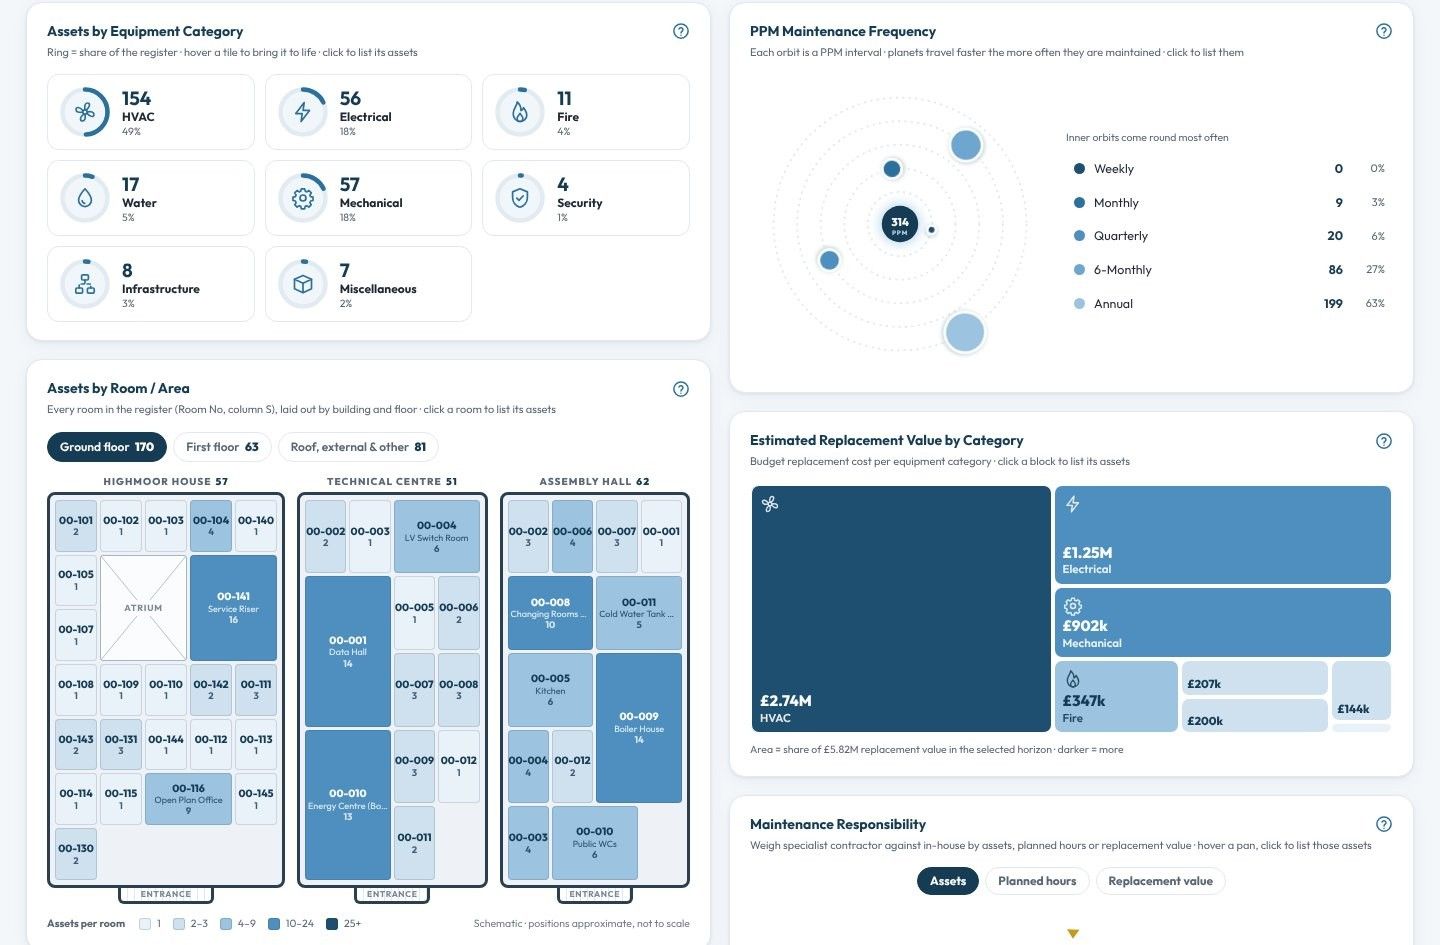
Assets by equipment category, and an interactive floor plan with every building laid out room by room. Select a room to list its assets – a contractor on their first visit can find the right plant without a guided tour.
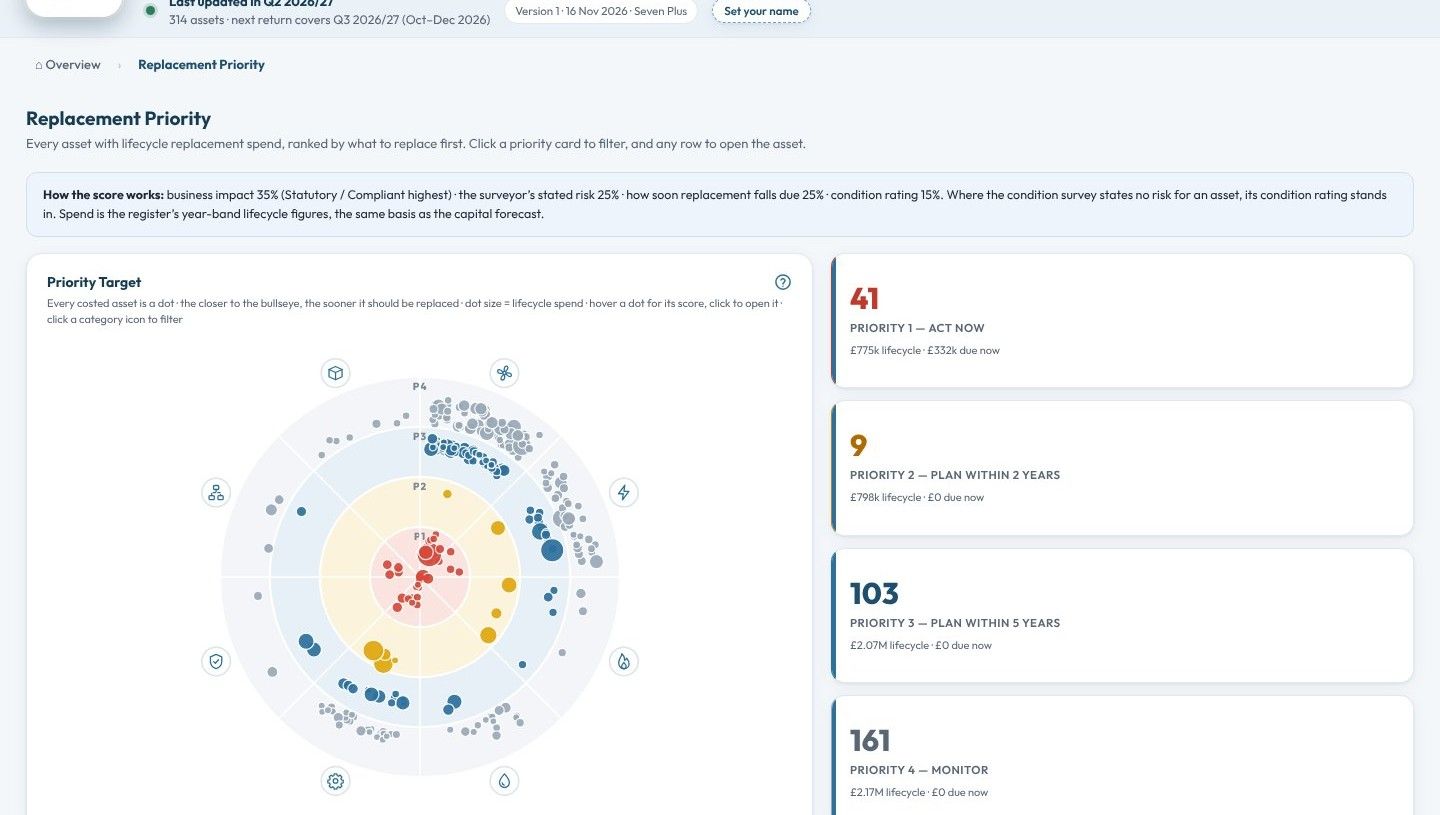
Every asset with replacement spend, ranked by what to replace first. The score weighs business impact, stated risk, how soon replacement falls due and condition. On the priority target, the closer an asset is to the bullseye, the sooner it should be replaced.
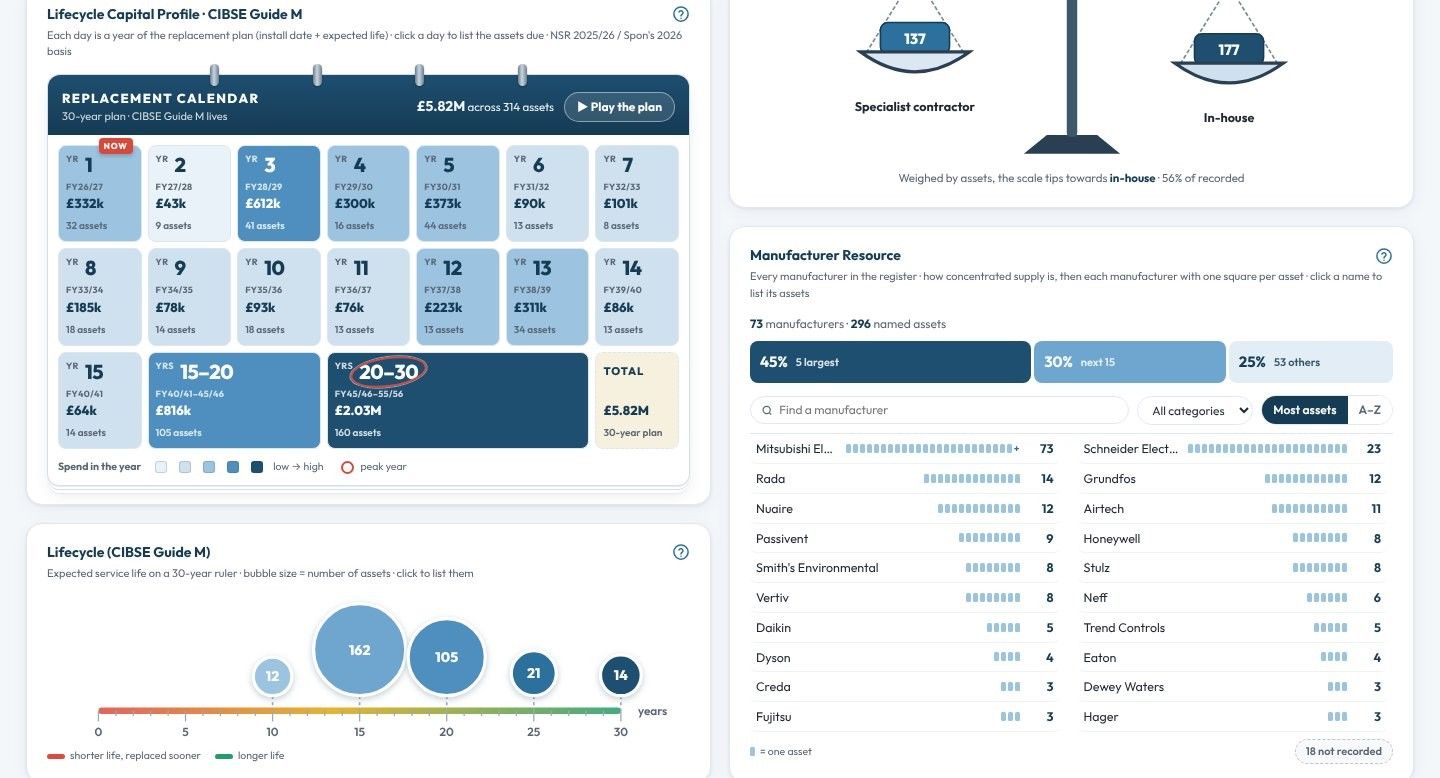
Thirty years of replacement on a single calendar, built from each asset's CIBSE Guide M expected life. Press play to watch the plan unfold, or set an annual budget line and see which years go over.
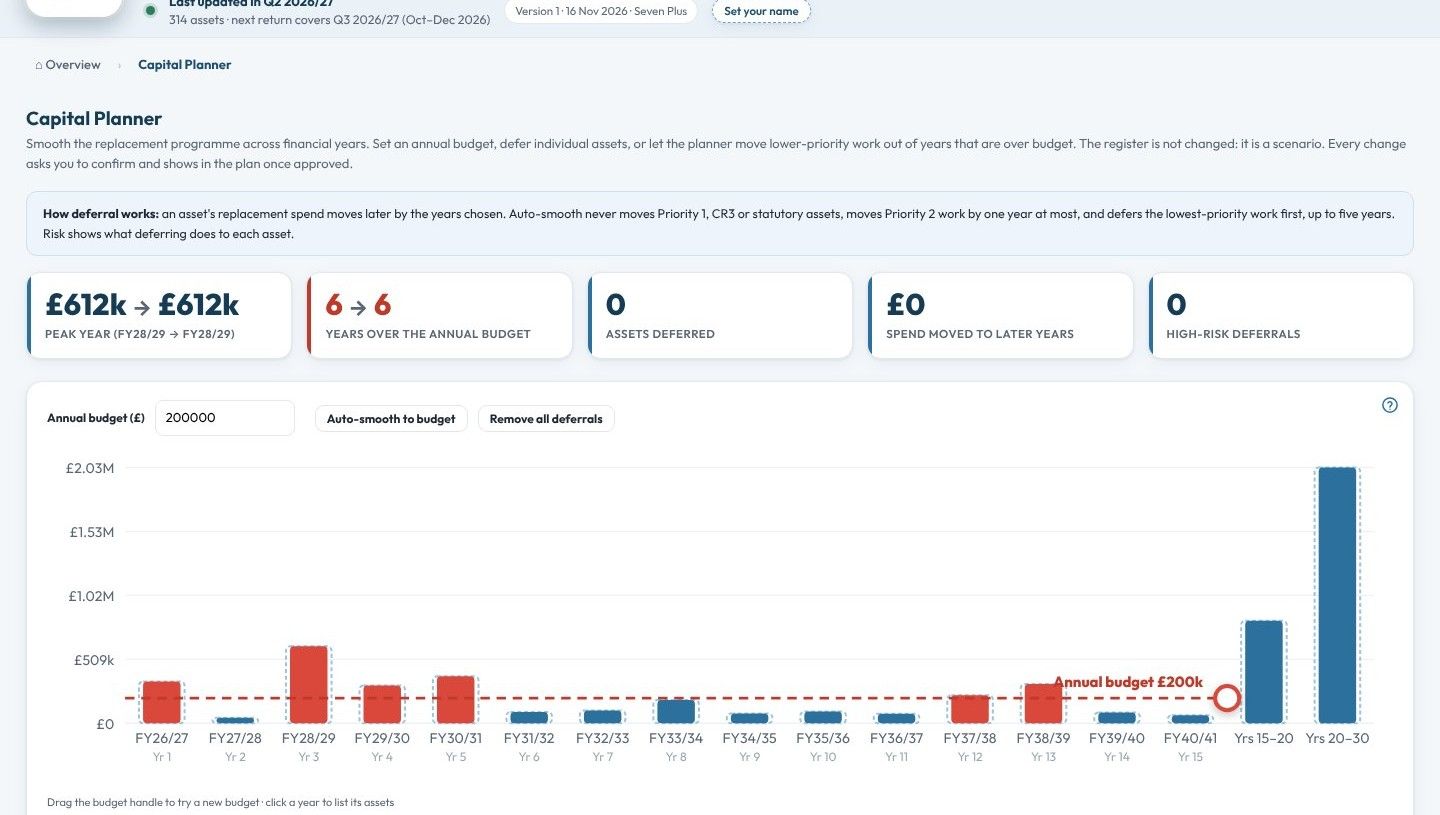
Smooth the replacement programme across financial years. Set a budget, defer individual assets, or move lower-priority work out of years that are over budget. Priority, poor-condition and statutory assets are never moved automatically, and the plan is a scenario – the register is not changed.
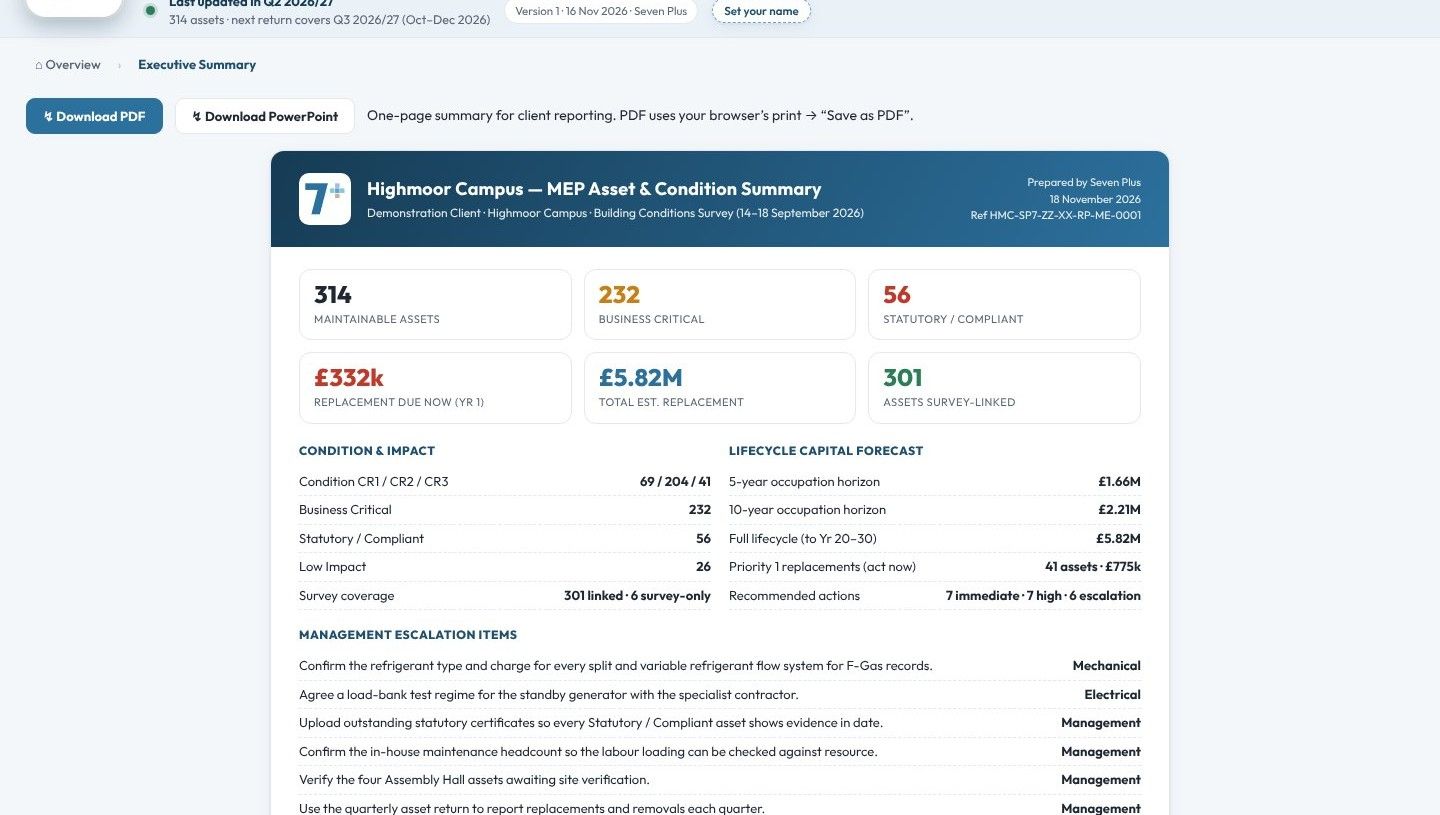
A one-page summary for board and client reporting: headline figures, condition and impact, the lifecycle forecast, compliance and the priority assets. Download it as a PDF or a PowerPoint.
When each asset's planned maintenance is next due, worked out from its last visit and its SFG20 frequency. Overdue visits, visits due within 30 and 90 days, and a twelve-month calendar, day by day.

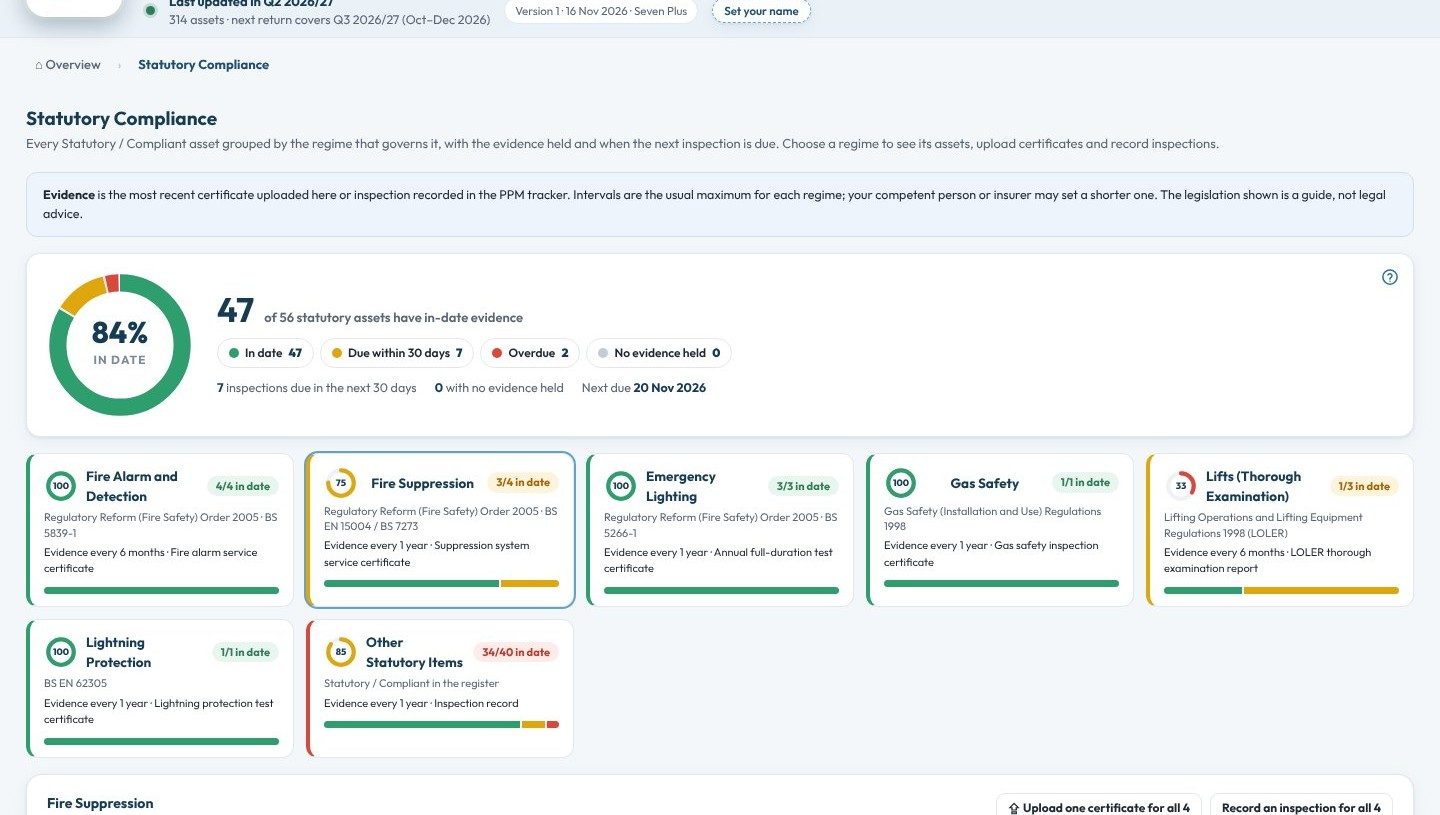
Every statutory asset grouped by the regime that governs it – fire, water hygiene, electrical, gas, lifting equipment, pressure systems and others – with the evidence held and when the next inspection is due. Status always shows in words as well as colour.
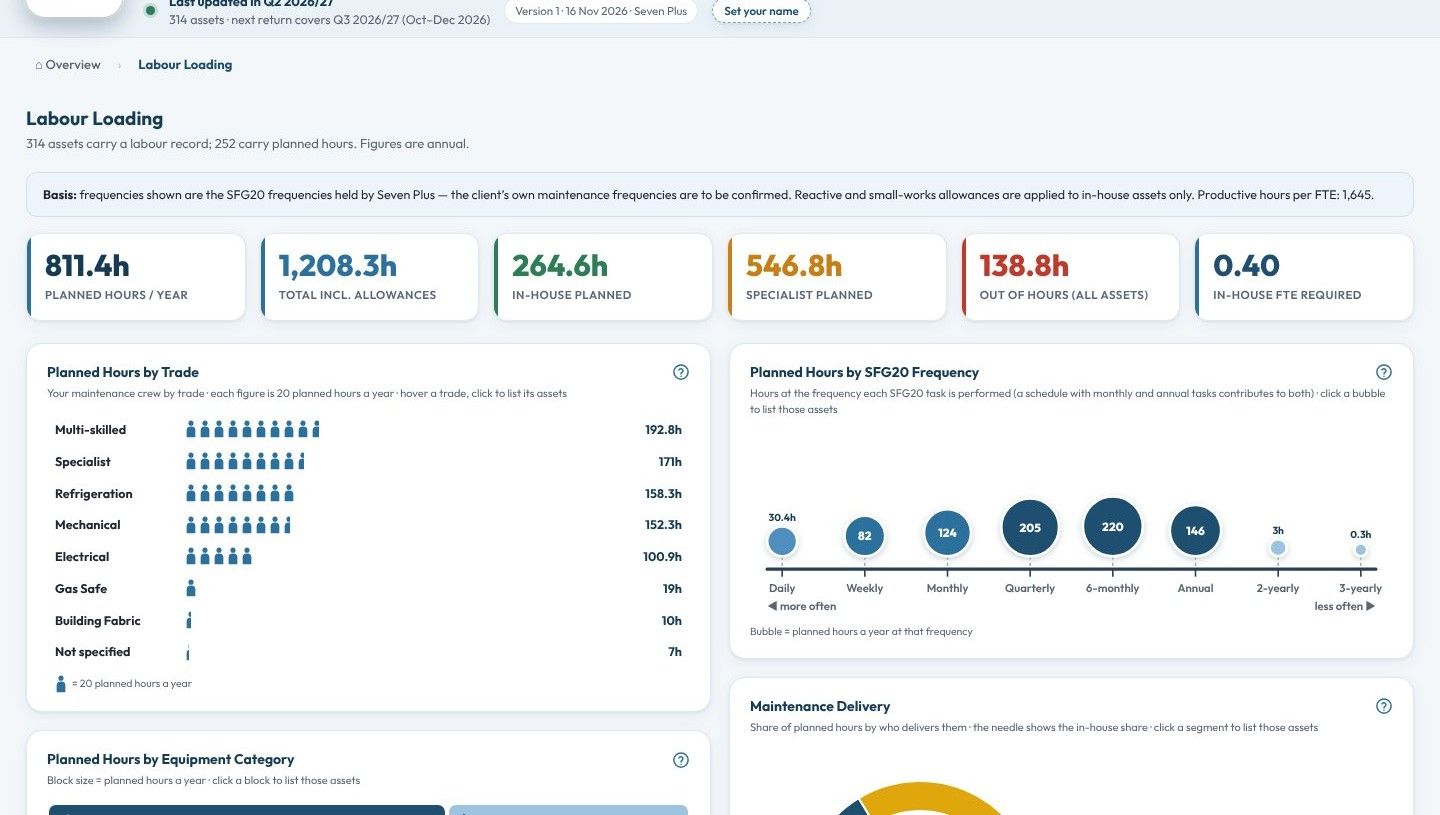
Planned maintenance hours a year from the SFG20 schedules, by trade, equipment category, frequency and delivery, with the in-house headcount the workload needs.
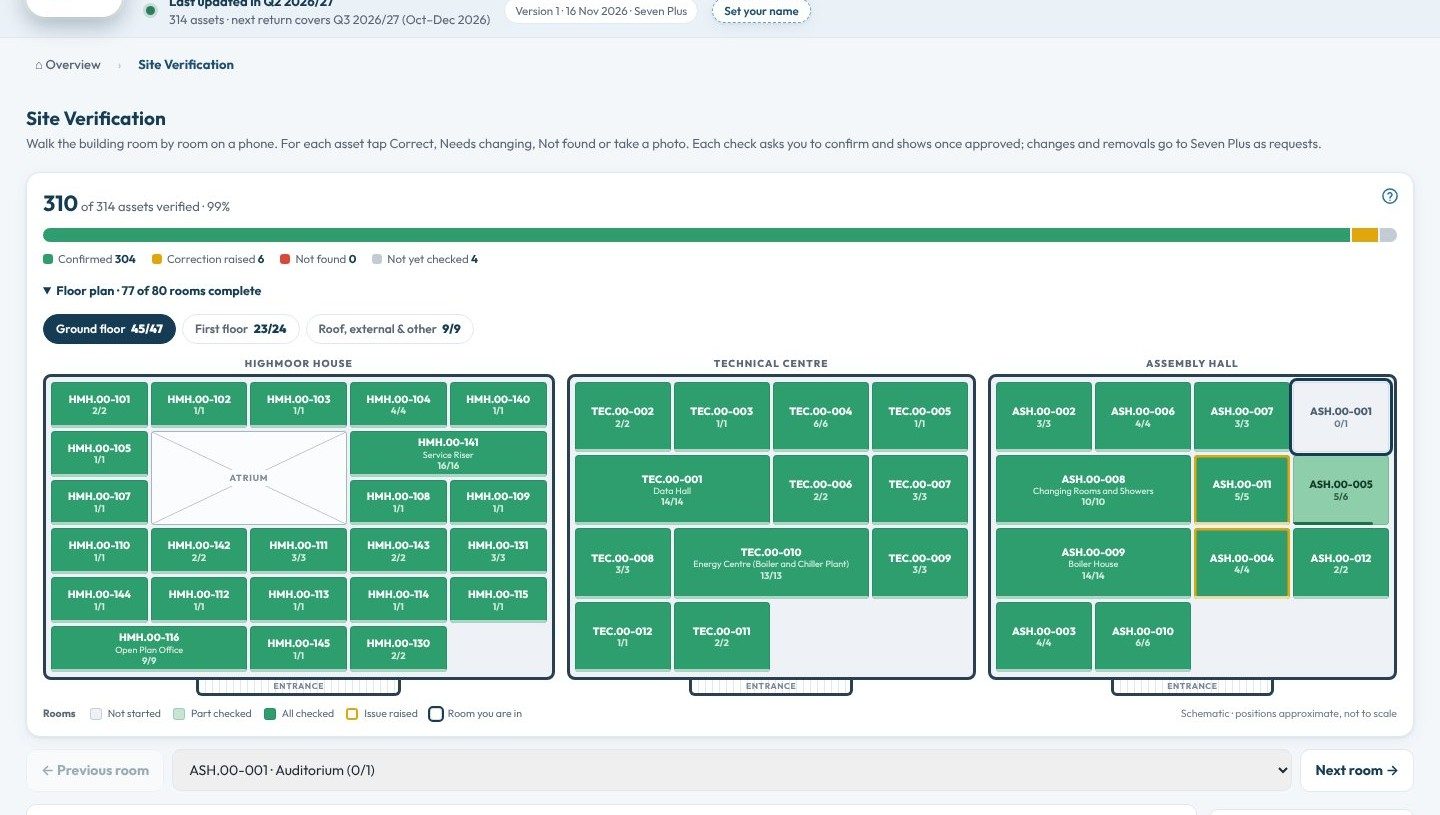
Walk the building room by room on a phone or tablet. For each asset, confirm it, flag that it needs changing, report it missing or take a photograph. Changes and removals come to Seven Plus as requests.
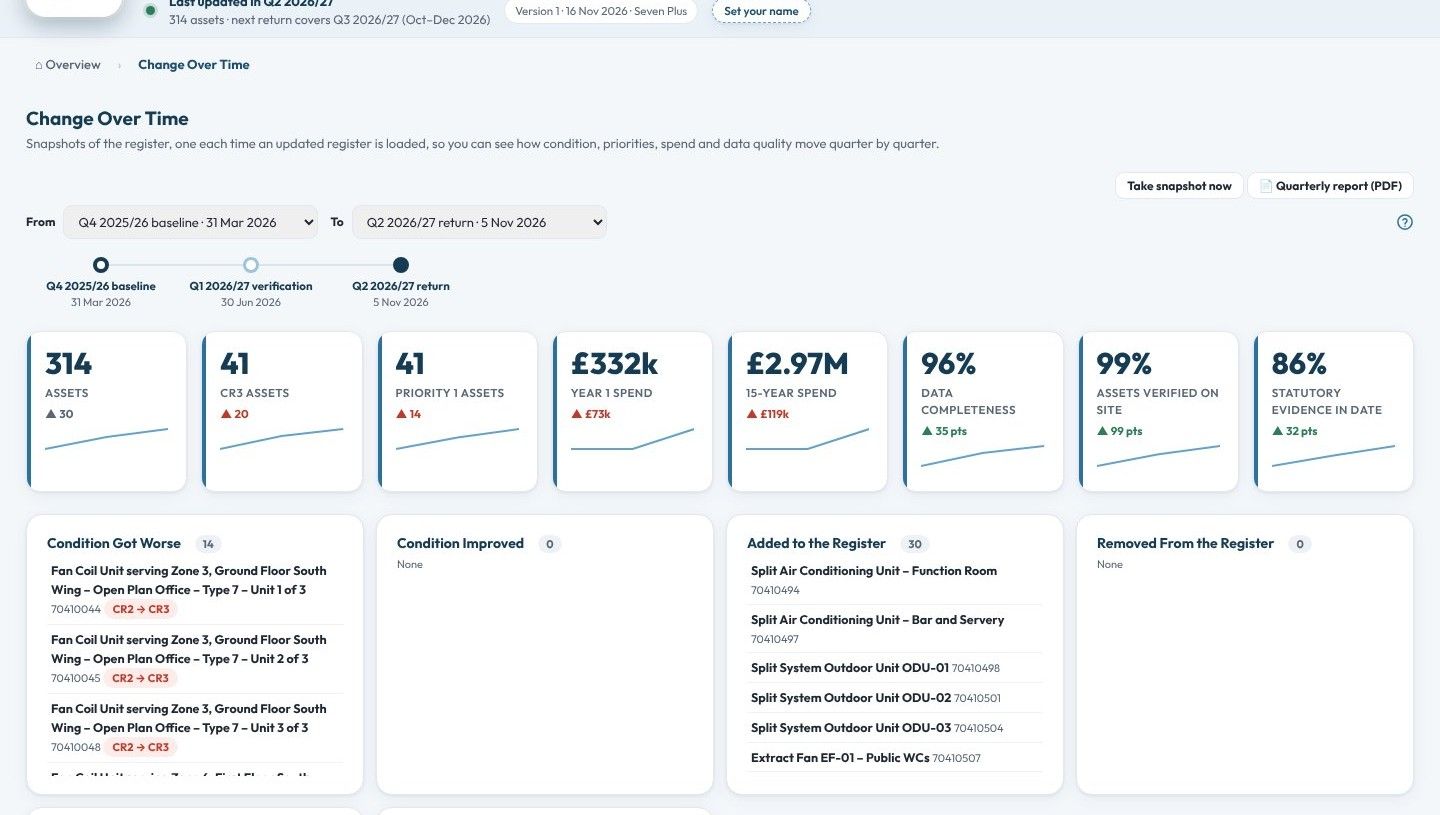
A snapshot of the register is kept each time it is updated, so you can see how condition, priorities, spend, data completeness and verification move quarter by quarter – and which assets changed.
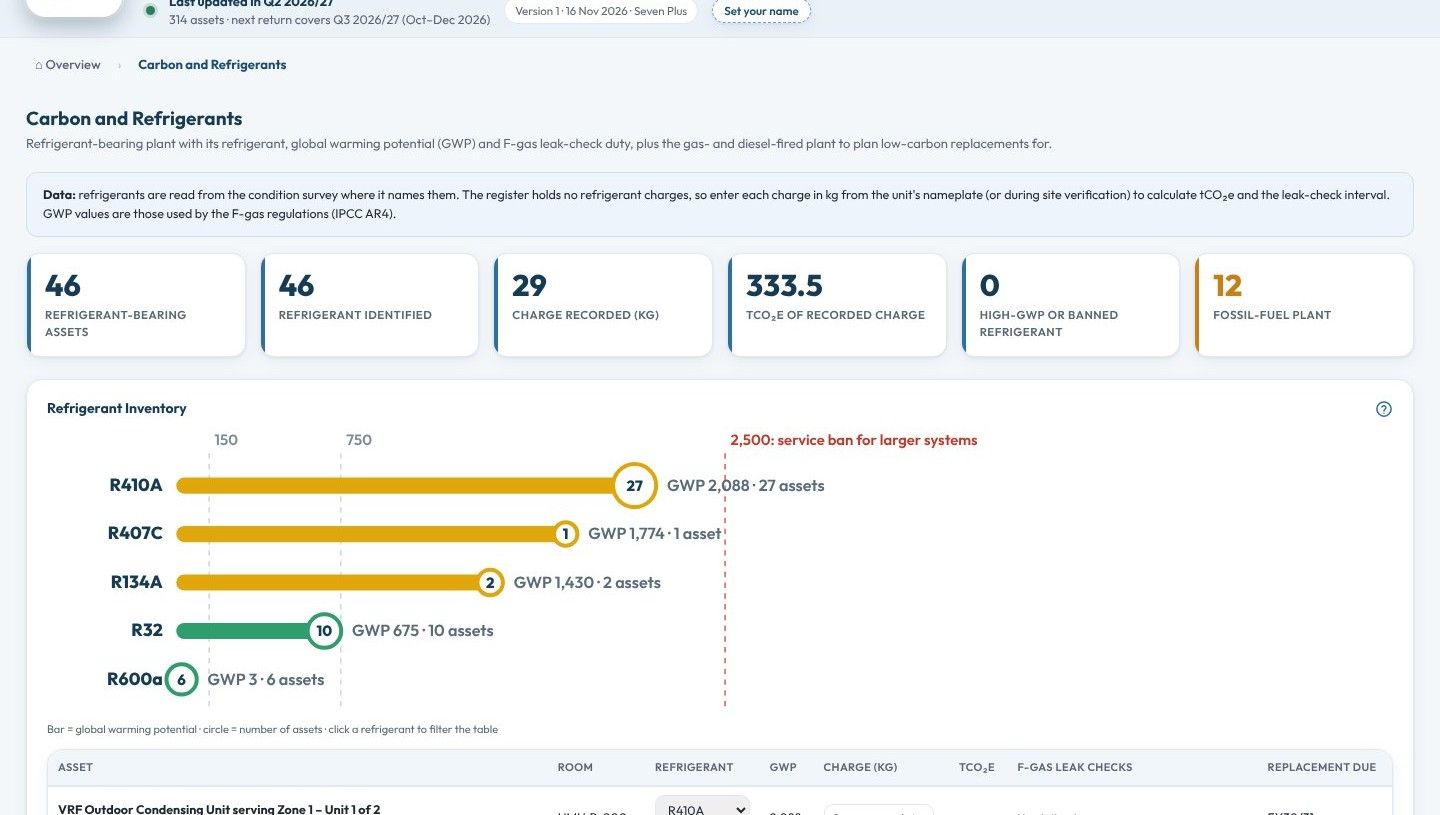
Refrigerant-bearing plant with its refrigerant, global warming potential and leak-check duty, plus the gas and oil-fired plant to plan low-carbon replacements for.
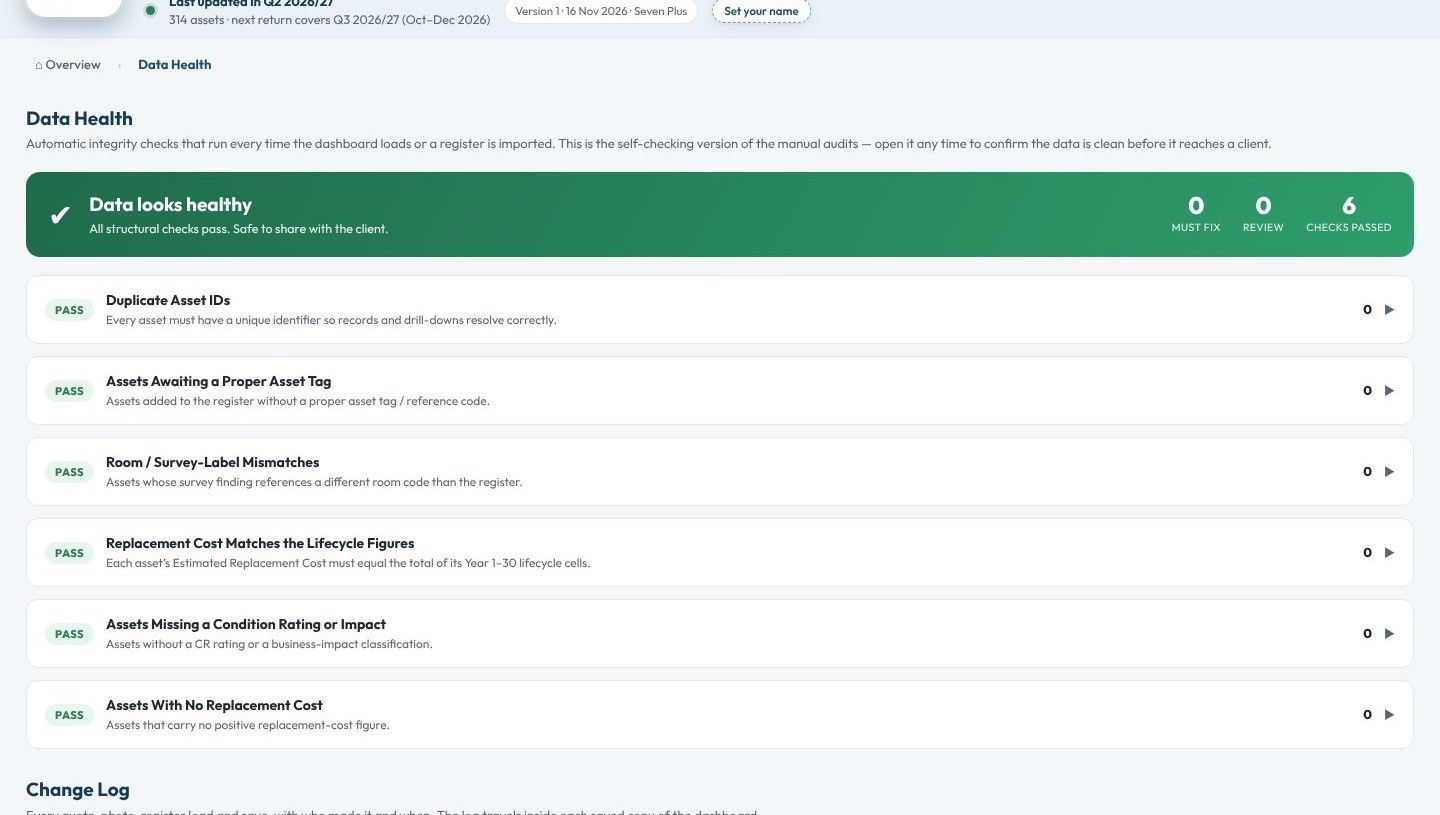
Automatic checks run every time the register is updated: duplicate asset identifiers, missing tags, room mismatches, missing ratings and more. The change log records every change, who made it and when.
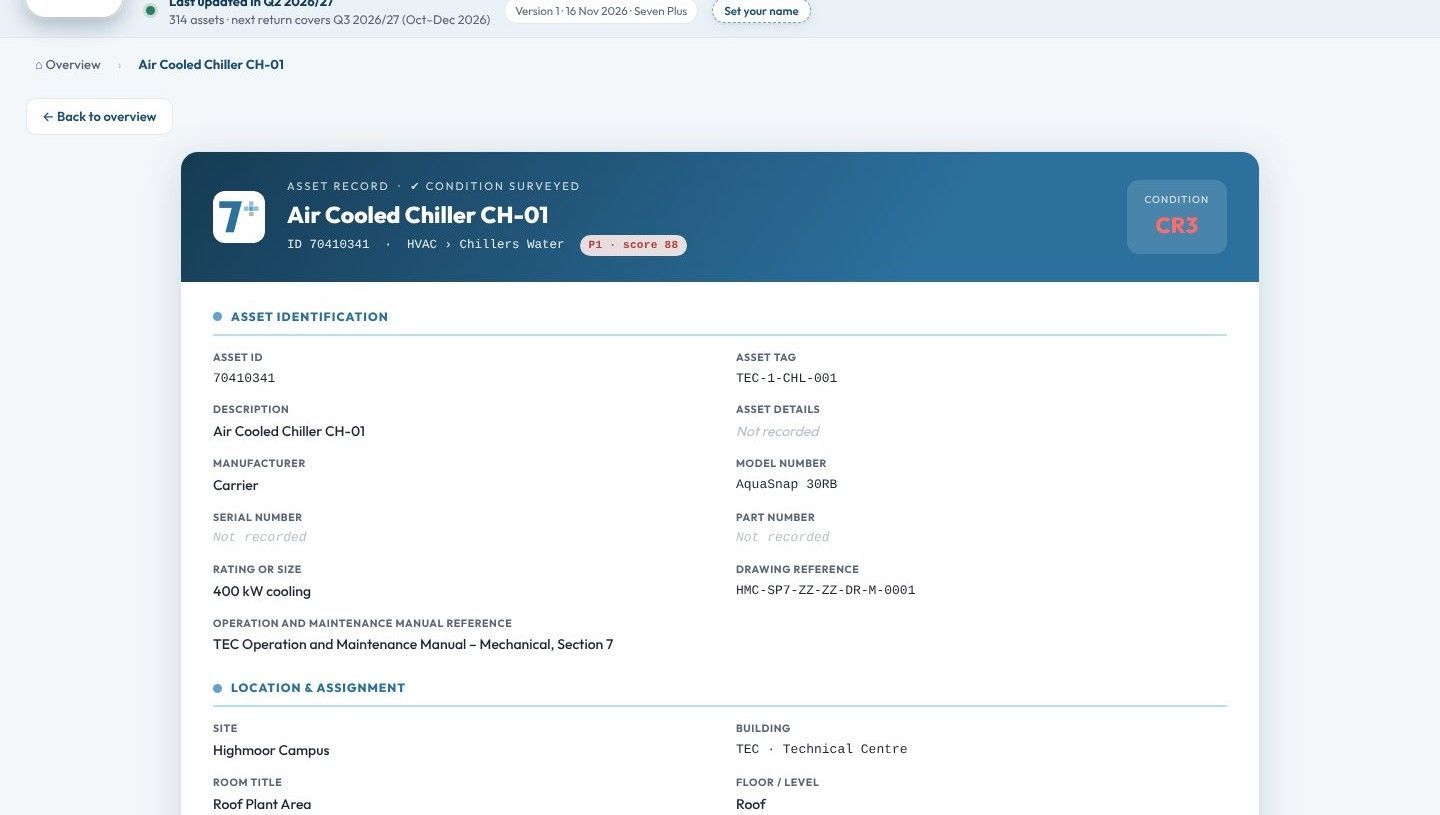
Every asset opens its full record: identification, location, maintenance and servicing, classification, condition, lifecycle costs and site verification, with a one-page business case for replacement.
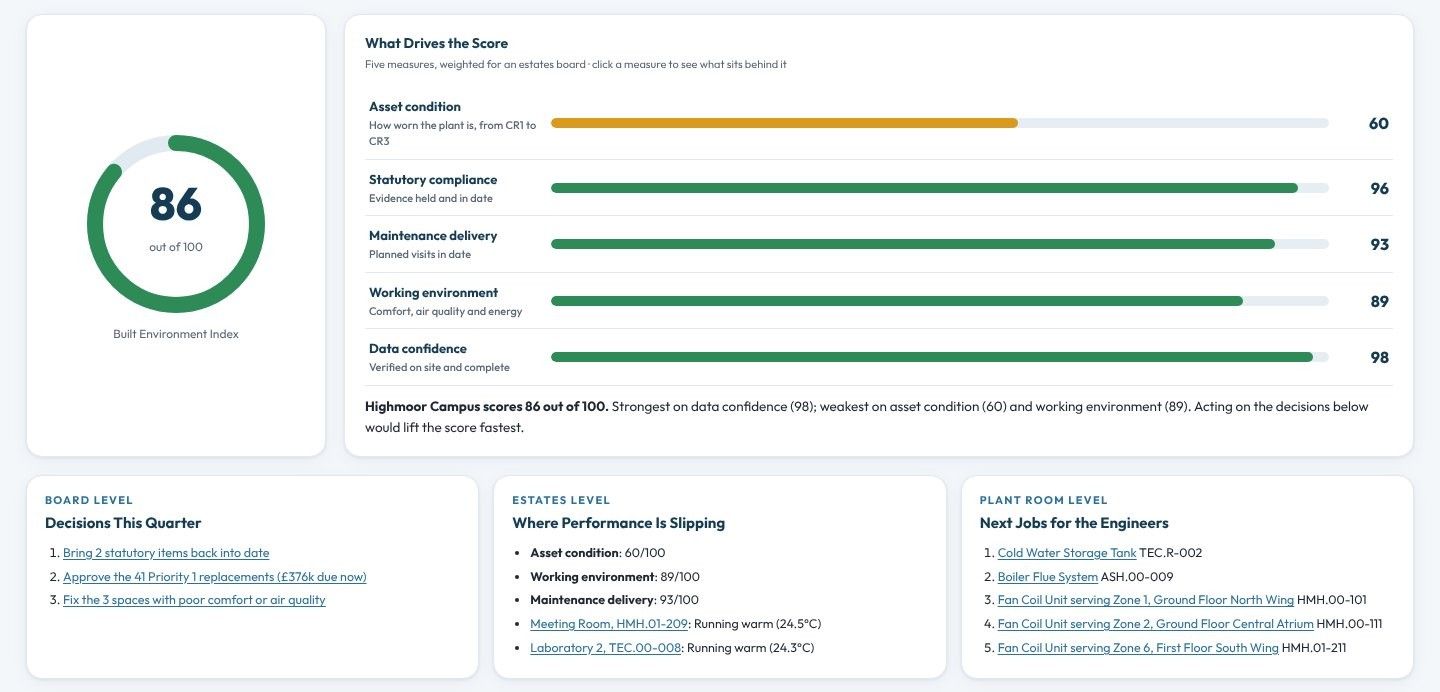
One score out of 100 for the whole estate, built from asset condition, statutory compliance, maintenance delivery, working environment and data confidence – shown at board, estates and plant room level.
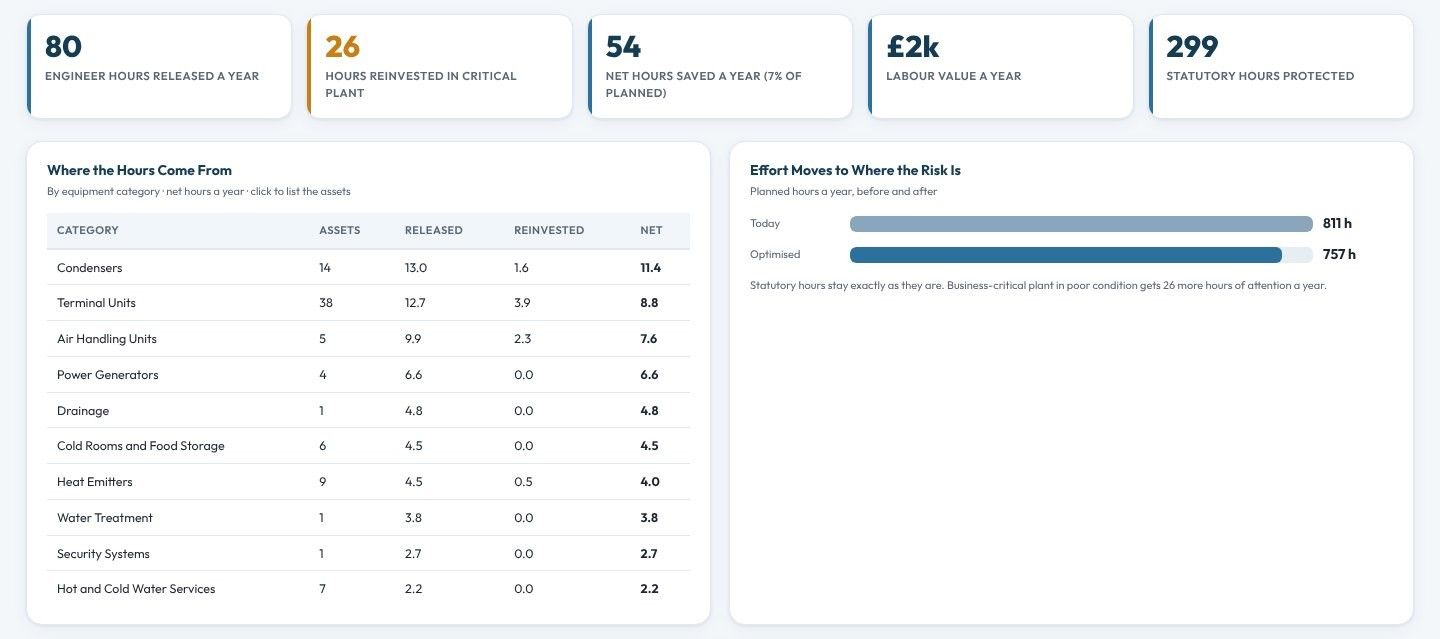
Proposes risk-based maintenance regimes from the SFG20 task classes. Statutory tasks never change; low-risk plant moves to the longer interval SFG20 allows, and some of the hours released are reinvested in critical plant.
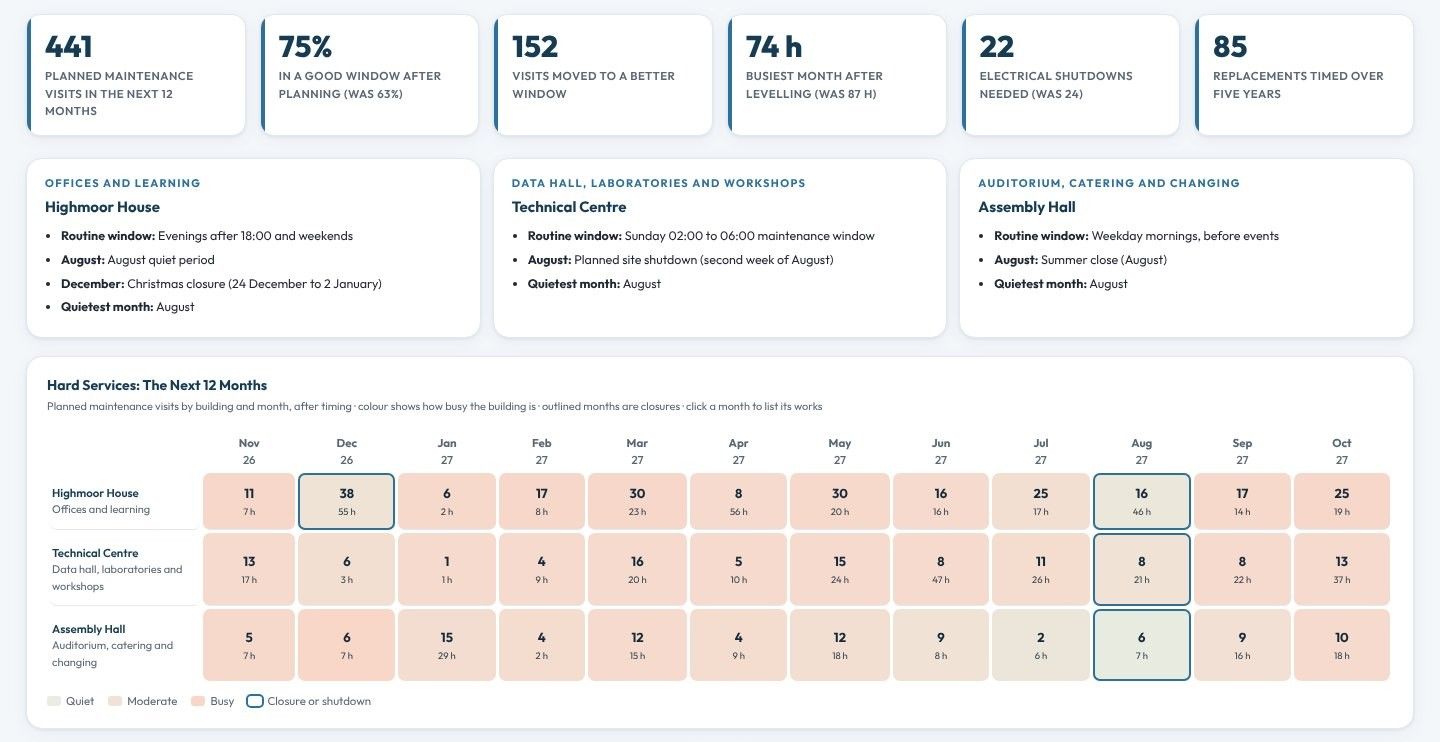
Finds the best month and time for every job over the next twelve months, for hard and soft services – around occupancy, closures, the seasons and your team's capacity. Statutory visits are never late.
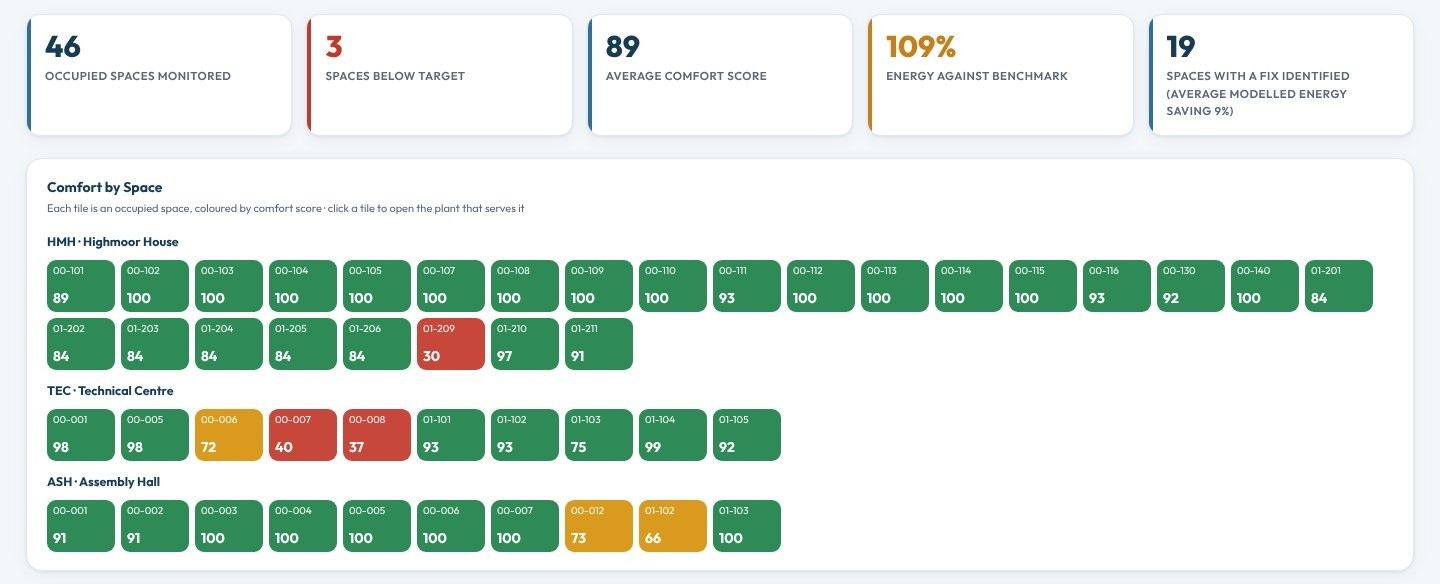
Comfort, air quality, humidity and energy for every occupied space, each scored out of 100 and traced back to the plant that serves it, with the fix and its modelled energy saving.
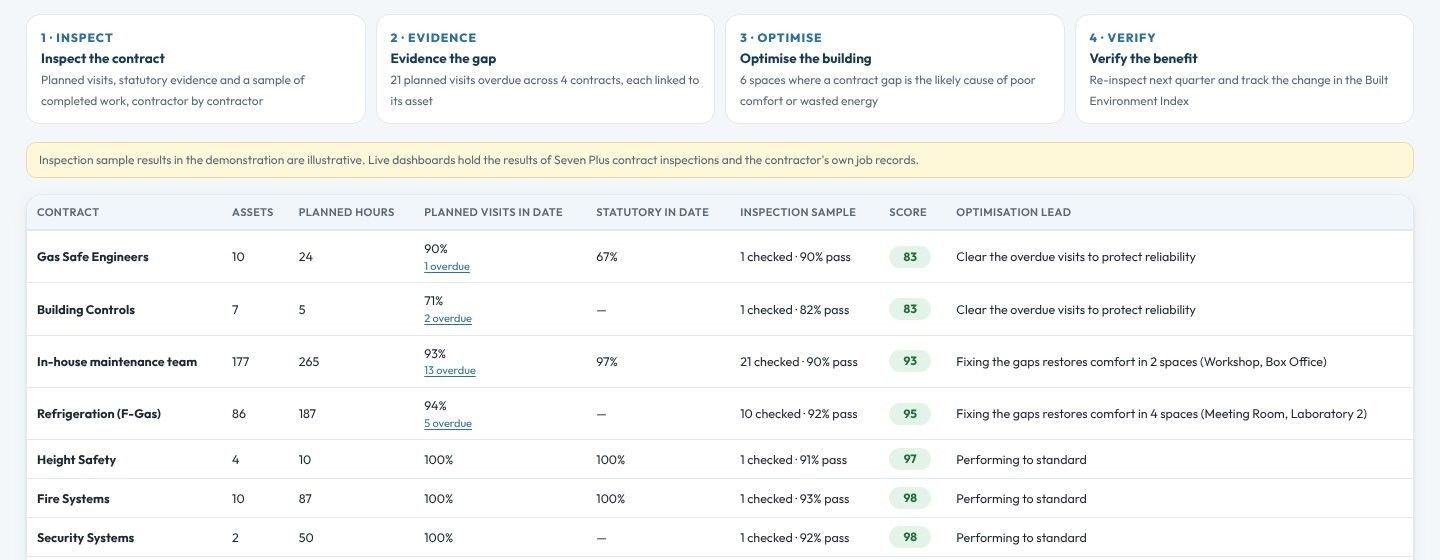
Inspect the contract, evidence the gap, optimise the building and verify the benefit. Each contract is scored on planned visits in date, statutory evidence and an inspection sample.
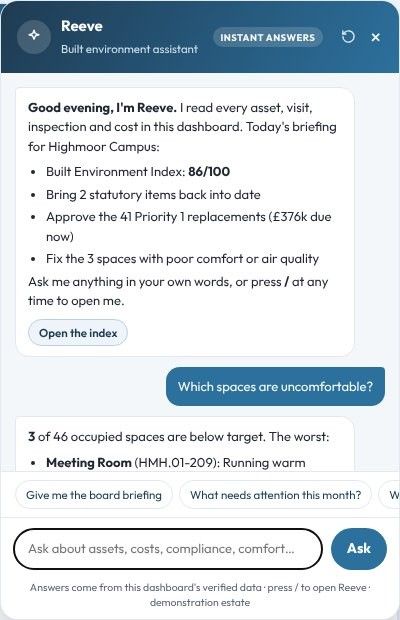
Reeve is the assistant built into the dashboard, named after the reeve who ran an estate day to day for its owner. Ask "Where should I spend £250k?" or "What can we do in the August closure?".
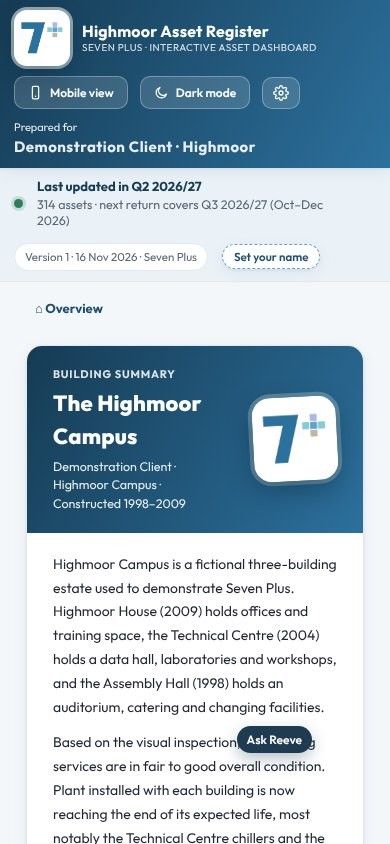
Screenshots are from the Seven Plus demonstration dashboard, which shows a fictional estate. Every name, room, reference and figure in it is invented. Your dashboard looks and works the same way, with your buildings and your data.
Book a 15-minute walkthrough of the live dashboard, or send us any asset list you already have and we will show you what it could become.